Measurement
INSIDE THE ACCOUNT S1E2: Does Meta's quality ranking tell you which ads make money?
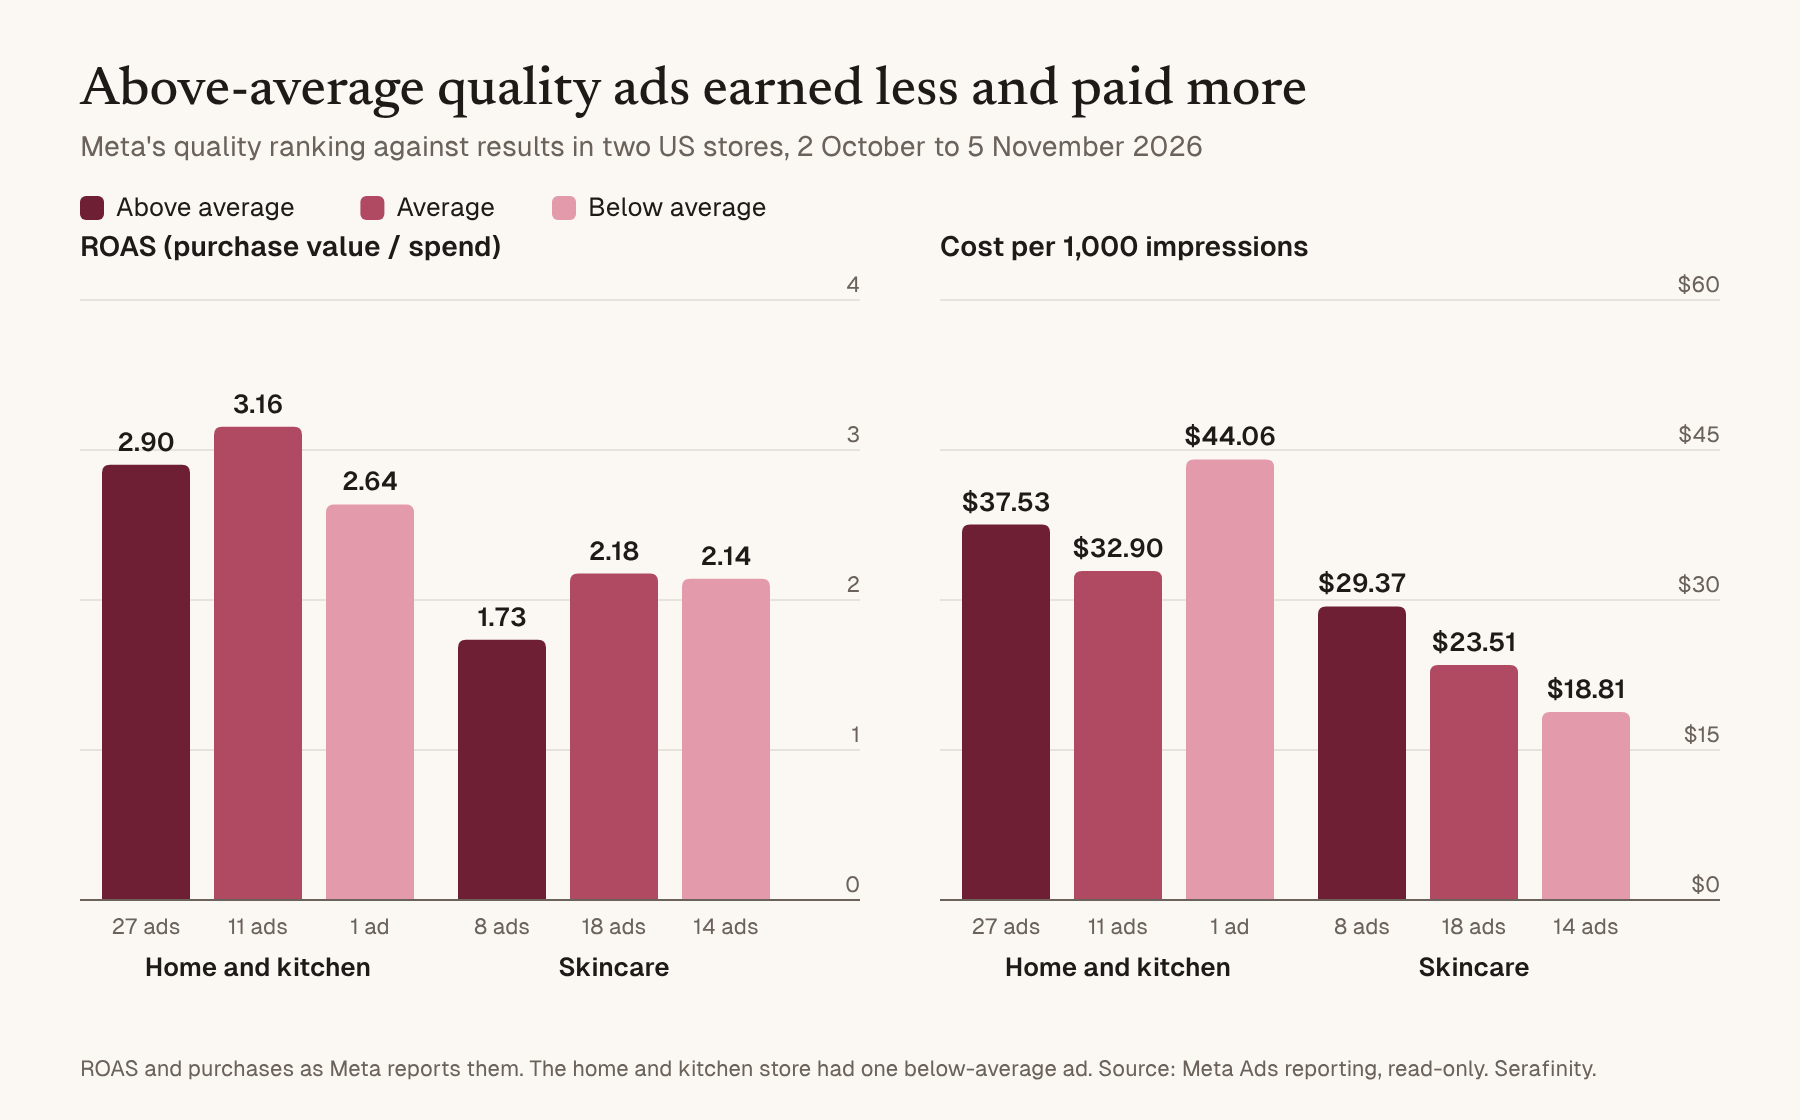
Not in these two accounts. In two US online stores, ads Meta rated above average for quality returned less per ad dollar than ads rated average (2.90 against 3.16, and 1.73 against 2.18) and paid more for impressions. Only the conversion rate ranking lined up with sales in both, and only loosely.
What are Meta's quality, engagement and conversion rate rankings?
They are three labels Meta calls ad relevance diagnostics, shown in Ads Manager for ads with at least 500 impressions. Each one compares your ad with ads competing for the same audience.
- Quality ranking: the ad's perceived quality, judged from signals such as people hiding the ad and low-quality traits like withheld information, sensational language and engagement bait.
- Engagement rate ranking: its expected rate of clicks, reactions, comments, shares and expands.
- Conversion rate ranking: its expected conversion rate, against ads with the same optimization goal.
Each label comes back as above average, average, or below average in the bottom 35%, 20% or 10%. Meta says the labels are not inputs into the ad auction, and that they are for diagnosing ads that miss their goal, not for tuning ads that already work. Meta keeps all three rankings for the last 35 days only, so we pulled the latest 35 days, in two stores: a home and kitchen brand spending about $610 a day and a skincare brand spending about $463 a day.
Do ads with an above-average quality ranking make more money?
In neither account. Ads rated above average for quality returned $2.90 in Meta-counted sales per ad dollar in the home and kitchen store, against $3.16 for ads rated average. In the skincare store it was $1.73 against $2.18.
| Account | Quality ranking | Ads | Spend | Purchases | ROAS | Cost per 1,000 impressions |
|---|---|---|---|---|---|---|
| Home and kitchen | Above average | 27 | $11,583 | 167 | 2.90 | $37.53 |
| Home and kitchen | Average | 11 | $4,364 | 69 | 3.16 | $32.90 |
| Home and kitchen | Below average | 1 | $1,896 | 26 | 2.64 | $44.06 |
| Skincare | Above average | 8 | $1,994 | 69 | 1.73 | $29.37 |
| Skincare | Average | 18 | $4,164 | 141 | 2.18 | $23.51 |
| Skincare | Below average | 14 | $6,175 | 215 | 2.14 | $18.81 |
ROAS (return on ad spend) here is purchase value divided by spend, both as Meta reports them. The gaps are too small to call the label backwards. When we resampled the ads 5,000 times, the above-minus-average difference ran from -1.02 to 0.86 in the first account and from -1.44 to 0.51 in the second, so zero sits inside both. What the data does show is that the label did not pick the better ads. Ranked ad by ad, the correlation between quality label and ROAS was 0.02 in one account and -0.06 in the other, which is no relationship. Comparing videos with videos closes the skincare gap but does not reverse it: the 7 above-average videos and the 14 average videos both returned 1.79.
Does a better quality ranking lower your ad costs?
Not in these numbers. In both accounts, ads rated above average for quality paid more per 1,000 impressions than ads rated average: $37.53 against $32.90, and $29.37 against $23.51. Meta's help page says that ads which are more relevant "cost less and see more results".
Two guides that rank for this question put numbers on it. One says lifting a quality ranking from below average to average can cut the cost per 1,000 impressions by 20% to 30%. Another says ads in the bottom 20% for quality can see that cost and the cost per click double. Neither shows the data behind the claim, so we checked both:
- Below average against average: in the home and kitchen store, the single below-average ad did pay more, $44.06 against $32.90, which fits the first claim. In the skincare store, the 14 below-average ads paid the least of the three quality groups, $18.81.
- Bottom 20%: the one bottom-20% quality ad, in the skincare store, paid $18.50 per 1,000 impressions against $29.37 for above-average ones, and $1.76 per click against $1.23. The home and kitchen store had no bottom-20% quality ad. No bottom-20% group on the other two rankings came close to double either.
Costs also depend on placement, format and audience. Even video against video in the skincare store, the above-average ads paid $29.97 against $27.26.
Does the engagement rate ranking predict clicks or sales?
It tracked clicks in the skincare store and ran against sales there. In the home and kitchen store, nearly every ad got the same grade.
In the home and kitchen store, 30 of the 35 ads with an engagement label were rated above average. The groups did run in label order (3.11, 3.05 and 2.64), but a label nearly every ad gets cannot separate them. Among ads with $100 or more of spend, all 10 of the best-returning ones had it, and so did all 4 that brought back less than they cost.
In the skincare store, the label followed the click-through rate closely. Above-average ads were clicked 2.89% of the time, average ones 1.90% and below-average ones 1.25%, a rank correlation of 0.65 at ad level. Sales went the other way: the 19 below-average ads returned 2.35 and the 9 above-average ones 1.79. Without the account's two catalog ads, the other 17 below-average ads still returned 1.89, against 1.79. Engagement means clicks, reactions, comments and shares, and none of those is a purchase.
Is the conversion rate ranking worth watching?
Of the three labels, it is the only one that lined up with sales in both accounts. In the home and kitchen store, the 14 ads rated average returned 3.44 and the 18 rated below average 2.56. In the skincare store, the 34 ads rated above average returned 2.16 and the 6 rated average 1.23. Both gaps held up when we resampled the ads: 0.09 to 1.67 in the first store and 0.37 to 1.90 in the second.
Two things limit it. The three home and kitchen ads rated above average returned 2.73 and turned 1.13% of their clicks into purchases, the lowest of the three groups. And in the skincare store the label barely varies: 34 of 40 ads were above average. In the home and kitchen store only 3 of 35 were. Because the label compares you with competing ads, it reflects the competition as well as your ads. Read it as a hint about the landing page and offer, not as a score.
Should you turn off an ad with below-average rankings?
Not on the label alone. In both accounts, Meta's own delivery put some of the most money behind ads that Meta's labels graded below average.
- Home and kitchen: the second-biggest spender, at $1,896 or 8.9% of the account, was below average on all three labels. It brought in 26 purchases at 2.64, and 1.88% of its clicks became purchases, against 1.47% across the store's 39 labelled ads. Meta's guide says that combination means "there's room for improvement across the board".
- Skincare: the biggest spender was a catalog ad at $3,792, 23.4% of the account. It was below average for quality and engagement and above average for conversion rate, and it brought in 142 purchases at 2.35, above the account's 2.11.
The ads that lost money did not stand out on the labels either. Eight labelled ads spent $100 or more and brought back less than they cost. Six of them had an above-average engagement label and four an above-average quality label. Meta's own guide says that "sometimes high performing ads have below average ad relevance diagnostics rankings".
Why do some ads get no ranking at all?
Passing 500 impressions does not guarantee one. In each account, 30 ads passed 500 impressions and got no label, carrying $3,142 and $3,808 of spend. The least-delivered ad with a label had 758 impressions in one account and 2,006 in the other.
The clearest pattern is how the ad is built. None of the 24 asset-feed ads with 500 or more impressions got a label, against 79 of the 115 other ads. Meta's API returns each of them as a set of assets rather than one fixed image, video or carousel, the way it stores flexible-format ads. Meta's pages say none of the three rankings is available for dynamic creative, the older multi-asset format, but say nothing about flexible format. Some of the biggest spenders sit in that gap: the home and kitchen store's fourth-largest ad ($1,430, 34 purchases, 3.27) and the skincare store's second and third ($1,273 and $1,109).
Separately, 4 home and kitchen ads had a quality label only. All 4 ran in ad sets optimized for purchase value, which Meta lists as an exception for the engagement and conversion rate rankings.
What should you judge Meta ads on instead?
- Judge each ad on cost per purchase or ROAS once it has enough purchases to mean something. Until then its ROAS is mostly noise: only 17 of the 39 labelled ads in one store and 18 of the 40 in the other had 5 or more purchases.
- Check those purchases against your store's own orders. Every ROAS in this post is Meta's count, and Meta's count often differs from the store's. Here is why Meta's purchases don't match Shopify.
- Use the labels the way Meta describes them: to diagnose an ad that is missing its goal. Of the three, start with the conversion rate ranking.
- Don't read a missing label as a problem. Asset-feed ads got none here, including ads that were selling.
- Compare an ad with similar ads in your own account. A catalog ad and a creator video reach different people at different prices, and the labels compare each with a different set of competitors.
Questions owners ask next
Do the rankings change what I pay for ads?
Meta says the labels "aren't inputs into the ad auction". They describe how an ad did against competing ads. In these two accounts, ads rated above average for quality paid more per 1,000 impressions than ads rated average, not less.
How many impressions before an ad gets a ranking?
At least 500, according to Meta. Here the least-delivered labelled ads had 758 and 2,006 impressions, and 30 ads in each account passed 500 without a label.
Why does my ad have above-average rankings but no sales?
Quality and engagement measure feedback and attention, not purchases. Of the 8 labelled ads here that spent $100 or more and lost money, 6 were rated above average for engagement. Check the landing page, the offer and the conversion rate ranking first, and then whether the budget changed.
About this data
Two US online stores' Meta ad accounts, 2 October to 5 November 2026: a home and kitchen brand (140 ads, $21,364 of spend, 324 purchases) and a skincare brand (80 ads, $16,198 of spend, 563 purchases). Serafinity reviewed the data read-only, pulled from Meta's reporting on 6 November 2026: every ad with impressions in the window, its three labels, and the creative behind it.
Purchases and purchase value are the purchases Meta credited to each ad under its ad set's own attribution setting, not the stores' order records. Group figures divide total purchase value by total spend, so bigger ads count for more. Resampling drew the ads 5,000 times with replacement. Format comes from each ad's creative record in Meta's API: asset-feed ads are those whose record holds a set of assets rather than one image, video or carousel. Brand names, products, creators, ad names and launch dates are removed, and both owners agreed to publication. Every figure was computed in code from the raw pulls, and the ad rows add up exactly to each account's totals. Two accounts over 35 days is a small sample, so read this as two worked examples, not a benchmark. Every ad, with its labels and results, is in the public data sheet.
The 79 labelled ads
Account 1 is the home and kitchen store and account 2 the skincare store. "Creator" marks a partnership ad posted from a creator's account. "None" means Meta returned no label for that ranking. All 220 ads, with impressions, clicks and the derived rates, are in the data sheet.
| Account | Ad ID | Format | Spend | Purchases | ROAS | Quality | Engagement | Conversion |
|---|---|---|---|---|---|---|---|---|
| 1 | 120254923251220210 | Video | $2,283.54 | 33 | 3.12 | Above | Average | Average |
| 1 | 120255138210550210 | Video (creator) | $1,896.15 | 26 | 2.64 | Below (35%) | Below (35%) | Below (35%) |
| 1 | 120254641039530210 | Video | $1,516.20 | 21 | 2.82 | Above | None | None |
| 1 | 120255314942180210 | Video (creator) | $1,344.12 | 25 | 3.64 | Average | Above | Average |
| 1 | 120255253243330210 | Video (creator) | $1,276.62 | 15 | 2.29 | Above | Above | Below (20%) |
| 1 | 120255109016400210 | Video (creator) | $1,050.38 | 13 | 2.43 | Above | Above | Below (35%) |
| 1 | 120255333140320210 | Video (creator) | $1,014.55 | 17 | 3.35 | Average | Above | Average |
| 1 | 120255315315270210 | Video (creator) | $950.19 | 9 | 2.15 | Above | Above | Average |
| 1 | 120254461787710210 | Video (creator) | $601.89 | 6 | 1.93 | Above | None | None |
| 1 | 120255817945250210 | Video | $499.20 | 15 | 5.41 | Above | Above | Average |
| 1 | 120254461849650210 | Video (creator) | $492.30 | 6 | 2.69 | Above | None | None |
| 1 | 120255333140340210 | Video (creator) | $468.54 | 11 | 4.29 | Above | Above | Average |
| 1 | 120254460377380210 | Video (creator) | $466.39 | 4 | 1.63 | Average | None | None |
| 1 | 120255817562960210 | Video | $382.30 | 10 | 4.90 | Above | Above | Average |
| 1 | 120255817458370210 | Video | $382.11 | 5 | 2.55 | Above | Above | Below (35%) |
| 1 | 120255253243340210 | Video (creator) | $355.39 | 8 | 4.06 | Average | Above | Average |
| 1 | 120255568713850210 | Video (creator) | $326.27 | 9 | 5.99 | Above | Above | Below (20%) |
| 1 | 120255568810010210 | Video (creator) | $312.62 | 8 | 5.43 | Average | Above | Above |
| 1 | 120255333140350210 | Video (creator) | $282.41 | 1 | 0.76 | Above | Above | Below (35%) |
| 1 | 120255200056280210 | Video (creator) | $220.39 | 1 | 1.02 | Average | Above | Above |
| 1 | 120255675449000210 | Video (creator) | $199.10 | 1 | 0.40 | Average | Above | Above |
| 1 | 120255817480220210 | Video | $187.59 | 3 | 4.09 | Average | Above | Average |
| 1 | 120255568907250210 | Video (creator) | $186.55 | 2 | 1.43 | Above | Above | Below (35%) |
| 1 | 120255935664840210 | Video | $147.90 | 1 | 1.53 | Above | Above | Average |
| 1 | 120255817562950210 | Video | $129.70 | 2 | 3.93 | Average | Above | Below (35%) |
| 1 | 120255817562940210 | Video | $119.79 | 0 | 0.00 | Above | Above | Average |
| 1 | 120255200040940210 | Video (creator) | $113.75 | 0 | 0.00 | Above | Above | Below (20%) |
| 1 | 120253798813870210 | Video (creator) | $92.57 | 2 | 3.79 | Above | Above | Below (20%) |
| 1 | 120255253243350210 | Video (creator) | $80.88 | 2 | 5.12 | Above | Above | Below (35%) |
| 1 | 120253798813890210 | Video (creator) | $71.29 | 0 | 0.00 | Average | Above | Below (10%) |
| 1 | 120254780907620210 | Video | $64.53 | 2 | 7.75 | Above | Above | Average |
| 1 | 120255878527230210 | Video | $62.74 | 0 | 0.00 | Average | Above | Below (20%) |
| 1 | 120253798813860210 | Video (creator) | $61.73 | 2 | 4.92 | Above | Above | Below (35%) |
| 1 | 120255333140330210 | Video (creator) | $58.31 | 1 | 3.52 | Above | Average | Average |
| 1 | 120255253243360210 | Video (creator) | $38.73 | 0 | 0.00 | Above | Above | Below (35%) |
| 1 | 120255568764800210 | Video (creator) | $36.87 | 0 | 0.00 | Above | Average | Average |
| 1 | 120253798813900210 | Video (creator) | $28.52 | 0 | 0.00 | Above | Average | Below (35%) |
| 1 | 120255817562970210 | Video | $22.66 | 1 | 8.54 | Above | Above | Below (35%) |
| 1 | 120253798813880210 | Video (creator) | $18.72 | 0 | 0.00 | Above | Above | Below (35%) |
| 2 | 120252580800330220 | Catalog | $3,791.70 | 142 | 2.35 | Below (35%) | Below (35%) | Above |
| 2 | 120252746297880220 | Video | $1,040.69 | 35 | 1.56 | Average | Above | Above |
| 2 | 120252677965660220 | Image | $729.49 | 25 | 1.81 | Below (35%) | Below (35%) | Above |
| 2 | 120252580729720220 | Catalog | $688.84 | 37 | 4.19 | Average | Below (35%) | Above |
| 2 | 120252709875020220 | Video | $581.18 | 14 | 1.90 | Average | Average | Above |
| 2 | 120252746321540220 | Video | $542.40 | 16 | 1.48 | Above | Average | Above |
| 2 | 120252677978680220 | Image | $526.52 | 13 | 1.74 | Below (35%) | Average | Average |
| 2 | 120252888849170220 | Video | $493.49 | 22 | 2.02 | Above | Above | Above |
| 2 | 120252803403230220 | Image | $338.36 | 6 | 1.31 | Below (35%) | Below (35%) | Above |
| 2 | 120252709906390220 | Video | $278.56 | 5 | 1.07 | Above | Average | Above |
| 2 | 120253108686530220 | Video | $276.82 | 17 | 3.36 | Above | Above | Above |
| 2 | 120252709913540220 | Video | $243.17 | 5 | 1.37 | Average | Below (35%) | Above |
| 2 | 120253156976470220 | Video | $222.17 | 11 | 3.37 | Average | Below (20%) | Above |
| 2 | 120253125311850220 | Video | $215.58 | 11 | 4.04 | Average | Below (35%) | Above |
| 2 | 120252888866110220 | Video | $173.76 | 3 | 0.77 | Average | Above | Above |
| 2 | 120252745647100220 | Video | $172.73 | 6 | 1.59 | Above | Below (35%) | Above |
| 2 | 120252709870270220 | Video | $141.39 | 3 | 1.36 | Average | Average | Above |
| 2 | 120252888792720220 | Video | $135.67 | 10 | 3.59 | Average | Above | Above |
| 2 | 120252803419410220 | Carousel | $119.44 | 3 | 1.40 | Average | Below (35%) | Average |
| 2 | 120253156953780220 | Image | $111.97 | 11 | 6.32 | Below (35%) | Below (35%) | Above |
| 2 | 120252677971630220 | Image | $108.08 | 1 | 0.70 | Below (35%) | Below (35%) | Average |
| 2 | 120253125333650220 | Video | $107.09 | 6 | 3.85 | Below (35%) | Average | Above |
| 2 | 120252888776660220 | Video | $104.12 | 3 | 0.90 | Below (35%) | Above | Above |
| 2 | 120252677990160220 | Carousel | $104.00 | 1 | 0.70 | Above | Below (20%) | Average |
| 2 | 120252887628310220 | Video | $99.50 | 1 | 0.51 | Average | Above | Above |
| 2 | 120252709823910220 | Video | $96.63 | 2 | 1.09 | Average | Average | Above |
| 2 | 120253010173830220 | Image | $88.63 | 1 | 1.13 | Average | Below (20%) | Above |
| 2 | 120252677956460220 | Video | $80.04 | 0 | 0.00 | Average | Below (20%) | Average |
| 2 | 120252803351800220 | Image | $79.36 | 3 | 1.31 | Below (35%) | Below (35%) | Above |
| 2 | 120252709881970220 | Video | $78.17 | 1 | 0.69 | Above | Above | Above |
| 2 | 120252888860430220 | Video | $77.86 | 2 | 1.08 | Below (35%) | Above | Above |
| 2 | 120252803363860220 | Video | $72.93 | 1 | 0.96 | Average | Below (10%) | Above |
| 2 | 120252746509650220 | Video | $63.10 | 1 | 0.60 | Average | Average | Above |
| 2 | 120252803391890220 | Image | $60.95 | 0 | 0.00 | Below (35%) | Below (35%) | Average |
| 2 | 120252709898090220 | Video | $60.10 | 1 | 0.50 | Average | Average | Above |
| 2 | 120252887745330220 | Video | $49.64 | 0 | 0.00 | Below (35%) | Below (20%) | Above |
| 2 | 120252677927080220 | Image | $49.20 | 1 | 1.58 | Below (20%) | Average | Above |
| 2 | 120252587214860220 | Video | $47.50 | 1 | 0.66 | Above | Average | Above |
| 2 | 120253156762150220 | Image | $40.88 | 2 | 1.91 | Below (35%) | Below (35%) | Above |
| 2 | 120253156910870220 | Image | $40.80 | 2 | 2.99 | Average | Average | Above |
Sources
- The account data described in About this data: Meta Ads reporting for both accounts, pulled read-only on 6 November 2026. Per-ad data sheet.
- Meta, "About quality ranking," Meta Business Help Centre, checked 6 November 2026. https://www.facebook.com/business/help/303639570334185
- Meta, "About ad relevance diagnostics," Meta Business Help Centre, checked 6 November 2026. https://www.facebook.com/business/help/403110480493160
- Meta, "How to use ad relevance diagnostics," Meta Business Help Centre, checked 6 November 2026. https://www.facebook.com/business/help/436113280262012
- Meta, "About engagement rate ranking," Meta Business Help Centre, checked 6 November 2026. https://www.facebook.com/business/help/2351270371824148
- AGrowth, "Facebook Ad Quality: How Rankings Impact Cost and Performance," checked 6 November 2026. https://noti.st/agrowth/f7d2Qd
- Influee, "7 Tactics to Fix Low Facebook Ad Rankings," checked 6 November 2026. https://influee.co/blog/low-quality-ranking-facebook-ads
More answers
Is my Meta traffic campaign to Walmart or Amazon a waste of money?
One brand spent $83,602 on Meta traffic ads to Walmart, Amazon and Target, and Meta counted 0 sales. What the clicks show, and how to measure the sales.
Should I increase my Meta ads budget for Black Friday 2026?
In a real audit, Black Friday week to Cyber Monday made a ROAS of 12.27 on 28% more spend a day than the four weeks before. How to set your 2026 Meta budget.
INSIDE THE ACCOUNT S1E1: Why did my giveaway lower my account ROAS?
A giveaway took account ROAS from 4.64 to 3.55: small orders, buyers moved from other campaigns, and $5,193 spent at 1.45 after the bonus ended.