Scaling
Why did my ROAS drop when I increased my Meta ads budget?
ROAS drops when you raise a Meta budget because of diminishing returns: each extra dollar buys less than the one before it, even while the average still looks healthy. In one real audit, spend above $5,000 a day returned 1.26 and then 1.02, against a break-even of 1.39.
What is the ROAS on the extra spend?
The ROAS on the extra spend is the extra sales a budget increase brings, divided by the extra money it costs. It answers the question a budget decision asks: what will the next dollar bring back?
Ads Manager shows the average, which blends the first dollars of the day with the last. So the average can stay comfortably above break-even while the last dollars lose money.
In the audit below, going from days that spent $3,500 to $5,000 to days that spent $5,000 to $6,500 added $1,019 of spend a day and $1,282 of sales a day. That step returned $1.26 for each extra $1, even though the average for those days was still 1.71. Going on to the highest-spend days added $1,606 of spend a day for $1,630 of sales a day: 1.02.
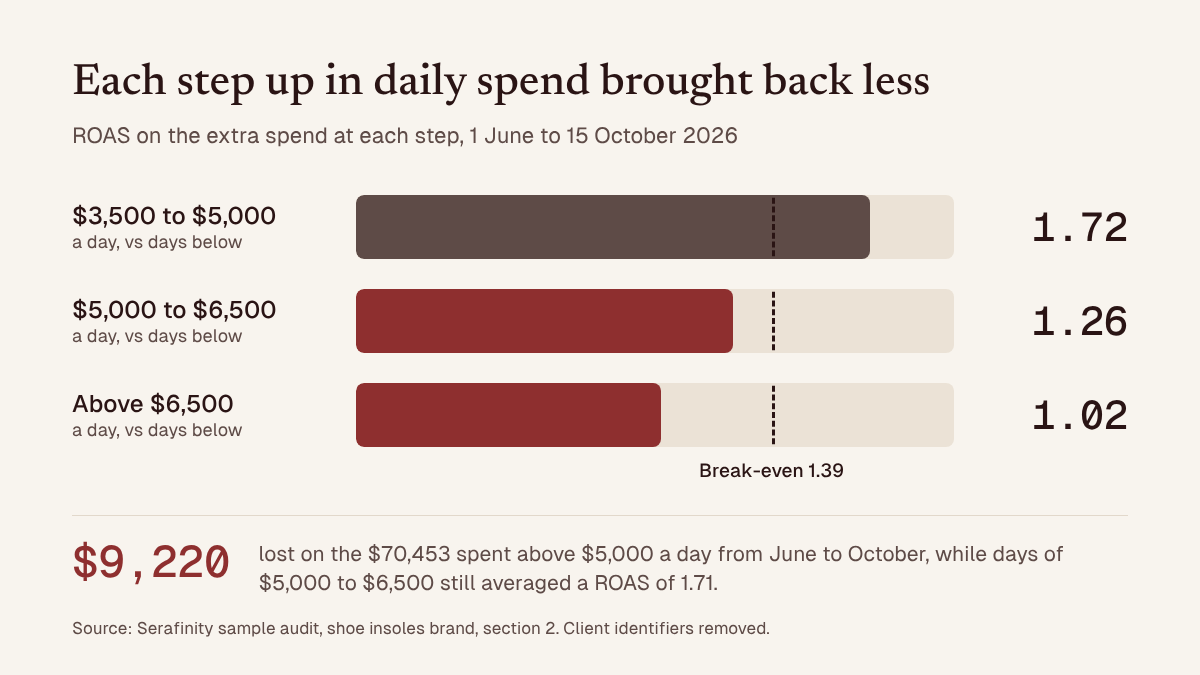
What happened when one account spent more each day?
The account made the most money on days that spent $3,500 to $5,000, and less, on average, in each group of days that spent more. It is an online shoe insoles brand that spent $749,655 on Meta in the six months to 15 October 2026.
From 1 June to 15 October it ran on automatic bidding, where Meta sets the bids itself, with the same product lines, while daily spend moved between $2,306 and $8,448. The audit grouped those 137 days by how much each day spent:
| Daily spend | Days | ROAS | Profit a day after ads | ROAS on the extra spend |
|---|---|---|---|---|
| Under $3,500 | 28 | 1.85 | $990 | |
| $3,500 to $5,000 | 38 | 1.81 | $1,319 | 1.72 |
| $5,000 to $6,500 | 48 | 1.71 | $1,219 | 1.26 |
| $6,500 and over | 23 | 1.55 | $782 | 1.02 |
Break-even for this account was a ROAS of 1.39, if every store order, including the quarter Meta does not credit, is counted as won by the ads. On Meta's count alone it would be nearer 1.83, and then even the first step would not pay. On the generous count, the first step up paid and the next two did not: the $70,453 spent above $5,000 a day lost $9,220, or $0.13 on every extra $1.
A curve fitted to all 137 days agrees that spend above $5,000 a day lost money: doubling a day's spend raised sales by only 70%. It put the most profitable day lower, near $3,800, with profit nearly flat up to $5,000.
Is a falling ROAS the law of diminishing returns?
Largely, yes: the law of diminishing returns says that if you keep adding one input while everything else stays the same, each addition eventually brings back less (Britannica). In advertising, the input is budget.
Economists worked it out on farmland. A farmer's first bag of fertiliser lifts the harvest a lot, the fifth a little and the tenth hardly at all, because the field stays the same size. An ad account's field is its audience and its ads.
Meta builds the same idea into Robyn, its open-source tool for measuring what each ad channel brings in: "each additional unit of advertising investment increases the response at a declining rate" (Robyn documentation). Media buyers call the return on the next dollar the marginal ROAS. It is what this post calls the ROAS on the extra spend.
Each extra dollar either reaches people the earlier dollars missed, who tend to be less likely to respond, or shows the ads again to people already reached. The insoles account shows the first kind.
The price of a thousand impressions rose only 9% from the lowest-spend days to the highest, and above $5,000 a day the share of clicks that bought held at 5.2% to 5.3%. What fell was the click rate: 1.44% of impressions on the top days, against 1.61% on days of $3,500 to $5,000, so a click cost $1.50 instead of $1.28. The extra money reached people less likely to click, which points at the audience and the creative, not the website.
Is the extra budget just showing the same people more ads?
Sometimes. Frequency, the average number of times each person saw the ads, is how you tell: if it climbs with spend, the budget is buying repeat views rather than new customers.
In a pet skincare account, spend rose 4x between the first and third quarter of 2026, and revenue 2x. Each added dollar returned $0.70 on Meta's own count.
Monthly spend rose 5.6x between March and September, and frequency rose from 1.93 to 3.29 over the same months. The audit's reading: most of the extra budget went on showing more ads to a pool that grew far more slowly than the budget did. Not all of the fall was the budget. The same audit found four different campaign structures in nine months, and the price of impressions jumped in April, before the biggest increases.
Metricool's 2026 report, covering more than 600,000 Meta and TikTok campaigns, shows a similar trend across advertisers. ROAS fell from 5.48 to 4.57 in a year while total ad spend in its data more than doubled (Metricool on why ROAS is falling). That is a trend across many accounts, not a test of one budget.
Is it just the learning phase?
A short dip after a big budget change can be the learning phase, but a drop that lasts for months is unlikely to be learning alone. Meta says results are less stable while an ad set is learning.
A large budget increase can send an ad set back into learning (Jon Loomer on the learning phase), so some swings in the days after a big change are just that.
The insoles finding compares 137 days at different levels of spend, not the week after one change. Budgets moved often, about 1.7 times a day, so some high-spend days did follow an increase, which is one more reason the audit asks for a controlled test. Profit a day still fell at each step above $5,000.
The audit is also open about the season. Every day in the lowest group was in June or July, and every day in the top group in August or September.
One fact cuts against a purely seasonal reading: in October, ROAS recovered to 1.72 as spend fell back to $4,990 a day. One fact fits it: September made 1.59 on less spend a day than August's 1.69. The loss also assumes the extra spend brought uncredited store orders in the same proportion as the rest; on Meta's count alone it was $23,768. The plan settles the season question with a controlled test, described below, and the store question by reading the store's own orders by day.
How do you find the budget where your ROAS stops paying?
Group your own days by spend and compare each group with the one below it. You need enough daily data on one bidding setup for at least three weeks of days in each band, which usually means three months of data or more.
- In Ads Manager, export spend and purchase value by day at account level, for a period with no big changes to bidding or to the attribution setting (the window in which Meta credits a sale to an ad).
- Sort the days into three or four bands of daily spend. Check that no band is mostly one month or mostly sale days; if one is, treat the result as a lead, not an answer.
- For each band, work out the average spend a day and the average sales a day.
- Between each band and the one below it, divide the extra sales a day by the extra spend a day. That is the ROAS on the extra spend.
- Compare each step with your break-even ROAS. Work break-even out from the store's orders, not only Meta's, as we explain in why Meta's purchases don't match Shopify.
The last step that clears break-even puts your ceiling roughly at the top of that band, and possibly below it. In the insoles account that pointed to about $5,000 a day, while the fitted curve put the most profitable day nearer $3,800. The account had gone above $5,000 on 19 of the last 30 days.
How should you raise a Meta budget without losing money?
Raise it one written step at a time, and judge each step by what the extra spend brought, not by the average alone. The audit's plan for the insoles account used these rules.
| Rule | What it means in practice |
|---|---|
| One step at a time | $5,000 a day, then $6,000, then $7,000, with no step skipped |
| Hold each step | At least seven days before it is judged |
| Judge the extra spend | Read the step against the days before it and against one campaign held at its budget, so season and offers show up in both |
| Step back on a fall | If overall ROAS falls more than 5% on two readings in a row, go back a step and find the cause |
| Change one thing | No new structure, offer or attribution setting in the week of a step |
| Move budgets once a day | At most, on campaign budgets |
| No reading, no step | If a gate cannot be read, the answer is no and the budget stays at the cap |
What has to hold before each step up?
Written results, agreed before the step, so nobody decides in the moment. Before the move to $6,000 a day, the insoles plan required, among other gates, at least 14 clean days at the cap and ROAS at or above break-even.
It also required the click ID, the tag that ties a sale to the ad that was clicked, on at least 75% of purchase events.
Holding back is not giving up. The audit projected that holding $5,000 a day would make a little more profit over the next 90 days than carrying on, on $65,353 less spend. And the cap was not fixed at $5,000: from 1 December, the plan resets it from the store's own order count, never above $5,000, which at the 76% share Meta was crediting came to $3,842 a day.
What else do people ask about scaling Meta budgets?
How much should I increase my Meta budget at a time?
There is no universal percentage. The insoles plan's first steps were $1,000 a day each from a $5,000 base, held for at least seven days. The size of the step matters less than being able to read it: one change at a time, against a campaign held flat.
Can spending more still pay?
Yes, at the bottom of the curve. Adding April and May to the insoles data, the steps below $5,000 a day returned 2.28 and then 1.58 on the extra spend, both above break-even, although the first is partly the season. The average ROAS may still dip as you spend more. What matters is whether the extra spend clears break-even.
Should I cut my budget if ROAS has dropped?
Find the step that stopped paying before cutting anything. In the pet skincare audit, the plan was to reduce budget deliberately, verify the numbers and rebuild the campaigns on one attribution window. In the insoles audit, it was to hold $5,000 a day through the peak, then reset the cap from the store's own order count and climb only through the written steps.
About this data
The figures come from two Serafinity sample audits, published with client identifiers removed. The insoles audit covers $749,655 of Meta spend from 16 April to 15 October 2026, with every daily figure computed in code from saved queries.
The pet skincare audit covers about $145,000 of spend from January to September 2026, on Meta's own count. Its first quarter counted only sales after a click, and its third also counted sales from people who saw an ad without clicking, so the fall it shows is, if anything, understated.
You can read the full insoles sample audit (PDF), sections 2, 17 and 20, or see what an audit of your own account costs. Serafinity audits accounts and does not run them, so nothing here is a pitch for management.
Sources
- Serafinity, Meta Advertising Audit and 90-Day Scale Plan, shoe insoles sample, pages 1, 2, 5, 6, 26 and 29.
- Serafinity, Meta Advertising Audit and 90-Day Scale Plan, pet skincare sample, pages 4, 6, 8 and 21.
- Encyclopaedia Britannica, Diminishing returns, Britannica Money.
- Meta Marketing Science, Robyn: Key Features, Robyn documentation.
- Jon Loomer, The Learning Phase Is Just a Label, 15 October 2025.
- Metricool, How to Improve ROAS: Why It's Falling and What to Do, 22 October 2026.
More answers
Inside the Account S1E1: Why did my giveaway lower my account ROAS?
A giveaway took account ROAS from 4.64 to 3.55: small orders, buyers moved from other campaigns, and $5,193 spent at 1.45 after the bonus ended.
Why don't my Meta ads purchases match Shopify?
In a real audit, Meta credited the ads with 76% of the store's orders. Why Meta ads purchases don't match Shopify, and how to check yours in 10 minutes.