Promotions
Inside the Account S1E1: Why did my giveaway lower my account ROAS?
Three things lowered it: the giveaway's orders were small, it took buyers from the other campaigns while total purchases stayed flat, and its budget stayed high for 4 days after the bonus ended. Account return on ad spend (ROAS) fell from 4.64 before the giveaway to 3.55 the week after.
What happened to orders when the giveaway bonus ended?
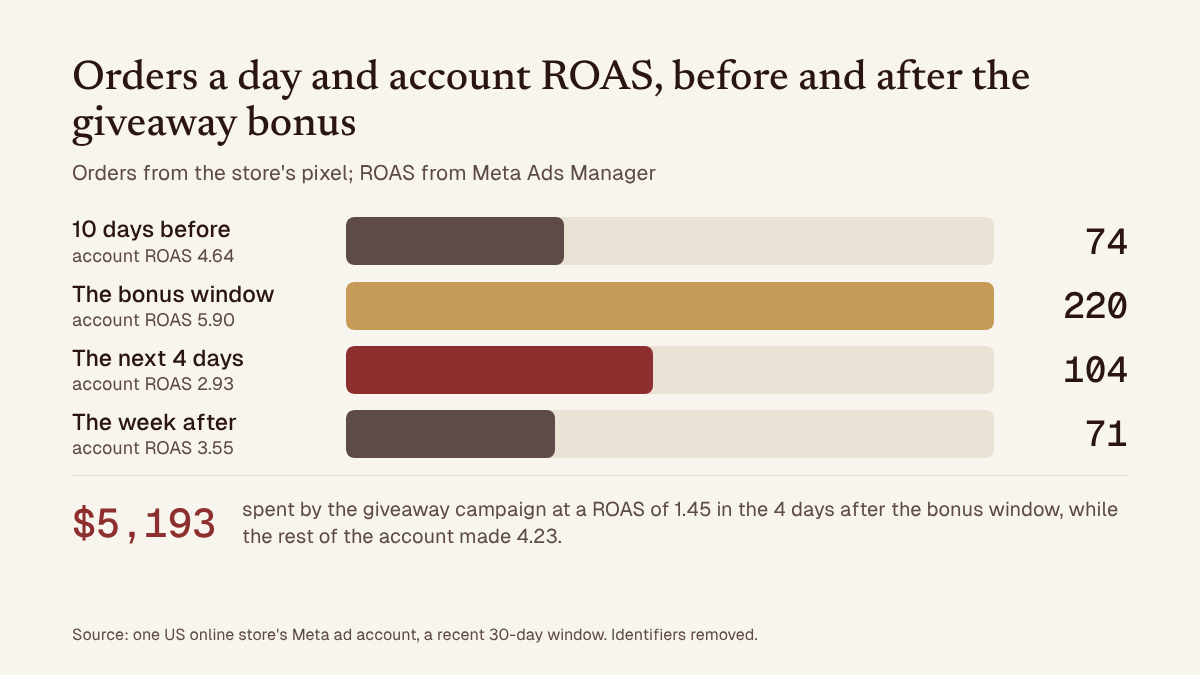
Orders went back to where they were before the giveaway started. The week after the bonus window averaged 71 orders a day, against 74 in the 10 days before the giveaway.
Orders a day here means purchases recorded by the store's own pixel: every order it sees, whether an ad drove it or a customer came straight to the site. ROAS, or return on ad spend, is the sales Meta credits to the ads divided by what the ads cost.
| Period | Orders a day | Ad spend a day | Meta sales a day | ROAS |
|---|---|---|---|---|
| 10 days before the giveaway | 74 | $1,464 | $6,801 | 4.64 |
| The bonus window | 220 | $3,329 | $19,645 | 5.90 |
| The next 4 days | 104 | $2,770 | $8,110 | 2.93 |
| The week after | 71 | $1,671 | $5,936 | 3.55 |
The week after ran 3 orders a day below the old pace, a 4% gap. The store's server-side count shows the same picture, with 84 purchase events a day before the giveaway and 81 after. The giveaway itself kept running the whole time. What ended was the bonus window, when every dollar spent earned extra entries. So the drop the owner sees is the fall from 220 orders a day to 71, and 71 is where the store normally sits.
If orders recovered, what went wrong?
The budget outlived the boost. When the bonus window closed, the ads switched back to the everyday giveaway message, but the campaign kept its $1,500 daily budget for 4 more days.
Those 4 days cost $5,193 at a ROAS of 1.45, so every dollar brought back $1.45 in Meta-reported sales. The rest of the account made 4.23 on the same days, and the giveaway campaign took 47% of all ad spend. Once its daily budget came down to $250, the giveaway campaign made 3.52 in the week after.
Part of that recovery comes from a second change. Two weak ads were switched off on the last high-budget day, so the budget cut and the clean-up landed together, and the 3.52 reflects both.
The same thing happens when a budget rises faster than demand. We looked at it with numbers from a different account in why ROAS drops when you increase your Meta ads budget.
Does a giveaway bring new buyers, or move them between campaigns?
In the week after the bonus window, it moved them. Total purchases a day stayed flat: 41.2 before the giveaway and 41.1 after.
The giveaway campaign won 76 purchases that week, 10.9 a day. The other campaigns lost the same 10.9 a day while spending 3% less. The purchases the giveaway did win were small, at $81.48 an order against $165.07 for the whole account before the giveaway. Order value means the sales Meta reports divided by the number of purchases.
| Campaigns and period | Purchases | Purchases a day | Order value |
|---|---|---|---|
| All campaigns, 10 days before | 412 | 41.2 | $165.07 |
| All campaigns, the week after | 288 | 41.1 | $144.28 |
| Giveaway campaign, the week after | 76 | 10.9 | $81.48 |
| Other campaigns, the week after | 212 | 30.3 | $166.80 |
Daily figures are rounded to one decimal, so 10.9 and 30.3 add up to 41.2 against a total of 41.1. The weekly counts add exactly: 76 plus 212 is 288.
Overall, the account spent 14% more a day than before the giveaway, and Meta reported 13% less in sales a day. This compares two periods, and other budgets moved in the same weeks. Still, when total purchases hold steady and one campaign's gain matches the others' loss, the simplest reading is that the giveaway relabelled buyers who were coming anyway.
Why did Meta rate the giveaway ads better than average?
Because Meta's benchmark judged cost per purchase, and giveaway orders were small enough to be cheap to win.
Cost per purchase is ad spend divided by purchases. Meta's peer benchmark rated the cost per purchase of the main giveaway ad set, the one that ran outside the bonus window, 36% better than similar advertisers. Over the 30 days, that ad set's ROAS was 2.10, the lowest of the 14 ad sets that spent more than $1,000. The next lowest was 3.03.
Order values explain the gap. Over the 30 days, orders from the bonus-window ad set averaged $90.96, orders from the main giveaway ad set $67.63, and orders from everything else $154.69. A main giveaway order was worth 44% of a normal one.
A benchmark built on cost per purchase rewards exactly that kind of order. It counts each purchase as one win whatever the basket holds, so a promotion that pulls in many small orders can rank well against peers while lowering the return on every dollar the account spends.
Could tired ads explain the drop instead?
Tired ads don't explain the drop in orders, but they are the next risk. Creator partnership ads carry this account, and they are starting to show wear.
A partnership ad is one a brand runs together with a creator, so the creator's account, the brand's or both appear in the ad's header. The 5 creator partnership ads took 27% of spend at a ROAS of 4.82, against 4.07 for the brand's own non-promo ads, at similar order values: $157.54 and $152.93. New brand ads launched during the 30 days made 3.62, and 4 of those 5 were switched off within 21 days.
That leaves a thin bench. 73% of spend went to ads made before the 30 days started, and by the end of the period the newest creator ad was 75 days old.
Meanwhile the creator campaign's daily spend rose 3.6 times across the 30 days, and its ROAS went from 5.06 in the first 7 days to 4.15 in the last 7. The extra spend still returned 3.80, with each added dollar earning less as the campaign grows.
Could a cheap placement explain it?
No. Audience Network distorts the account's click numbers, and it accounts for only 1.2% of purchases.
Audience Network is the part of Meta's ad system that shows ads inside other companies' apps. One of its formats is rewarded video, where people choose to watch a full-screen ad in exchange for a reward inside an app, such as game currency.
In this account Audience Network took 0.9% of spend and 9.2% of link clicks. Its rewarded-video slot had a link click-through rate (CTR, link clicks divided by impressions) of 30.6%, and only 67% of those clicks loaded the page, against 93% on the Facebook feed.
Conversion rate, the share of link clicks that became purchases, was 0.37% on Audience Network against 3.04% everywhere else. Meta credits it with 22 purchases and a ROAS of 9.35, which is too few purchases to trust that ROAS.
What needs changing is the reporting. Account CTR reads 0.96% with Audience Network included and 0.88% without it, so leave the placement on and read CTR and conversion rate with it filtered out.
How do you run the next boost without paying for the comedown?
Give the boost's budget the same end date as the bonus, and judge every promotion on ROAS and order value alongside cost per purchase. Six steps:
- Put the bonus in its own campaign, and on the day you launch it, set that campaign's end date to the moment the bonus window closes.
- Between bonus windows, pause the everyday giveaway ads for 7 days and compare store orders with the 74 a day the store averaged before the giveaway.
- Report every promotion on ROAS and order value next to cost per purchase.
- If you want bigger baskets from a giveaway, give bonus entries only to orders above a set amount.
- Add new creator partnership ads every week, so a replacement is proven before the current winners tire.
- Read CTR and conversion rate with Audience Network filtered out.
Questions owners ask next
Should I judge a promotion on cost per purchase?
Only alongside ROAS and order value. In this account the main giveaway ad set beat its peers on cost per purchase by 36% while its ROAS was 2.10, the lowest in the account.
How do I know if a giveaway is adding sales?
Compare the store's total orders and total purchases with the period before the giveaway, instead of reading the giveaway ads' own results. Here total purchases a day went from 41.2 to 41.1.
Do creator partnership ads beat brand content?
In this account, yes: a ROAS of 4.82 against 4.07, at similar order values. That is one account, so test it in yours.
If you want to see how a full review of an ad account reads, the sample audits show the method on real accounts, and pricing lists what an audit costs.
About this data
This post is a deep dive into one US online store's Meta ad account over a recent 30-day window: $55,677 of spend and 1,812 purchases as Meta reports them. The data is read-only: Meta's own reporting, its peer benchmark, and purchase counts from the store's pixel and server-side events. The store's name, products, prize and dates are left out. Every number was computed in code from the raw data and checked against a second, separate pull before publishing. Meta's purchase count and the store's own order count are different measures, for reasons covered in why Meta ads purchases don't match Shopify.
Sources
- The account data described in About this data: Meta Ads reporting, Meta's peer benchmark, and the store's pixel and server-side purchase events.
- Meta, About partnership ads, Instagram Help Centre, checked 2 November 2026.
- Meta, About rewarded video for mobile app ads, Meta Business Help Centre, checked 2 November 2026.
More answers
Why did my ROAS drop when I increased my Meta ads budget?
In one audit, spend over $5,000 a day returned 1.26, then 1.02, against a 1.39 break-even. Why ROAS drops as you increase a Meta budget: diminishing returns.
Why don't my Meta ads purchases match Shopify?
In a real audit, Meta credited the ads with 76% of the store's orders. Why Meta ads purchases don't match Shopify, and how to check yours in 10 minutes.