Scaling
How do I scale my Meta ad spend profitably?
Raise the budget in steps of about 20%, hold each step for at least a week, and judge it by what the extra spend earns against your break-even, not by average ROAS. In one real store, the next dollar earns about 6.26 against a break-even of 3.50.
Why does my ROAS go up when I spend more?
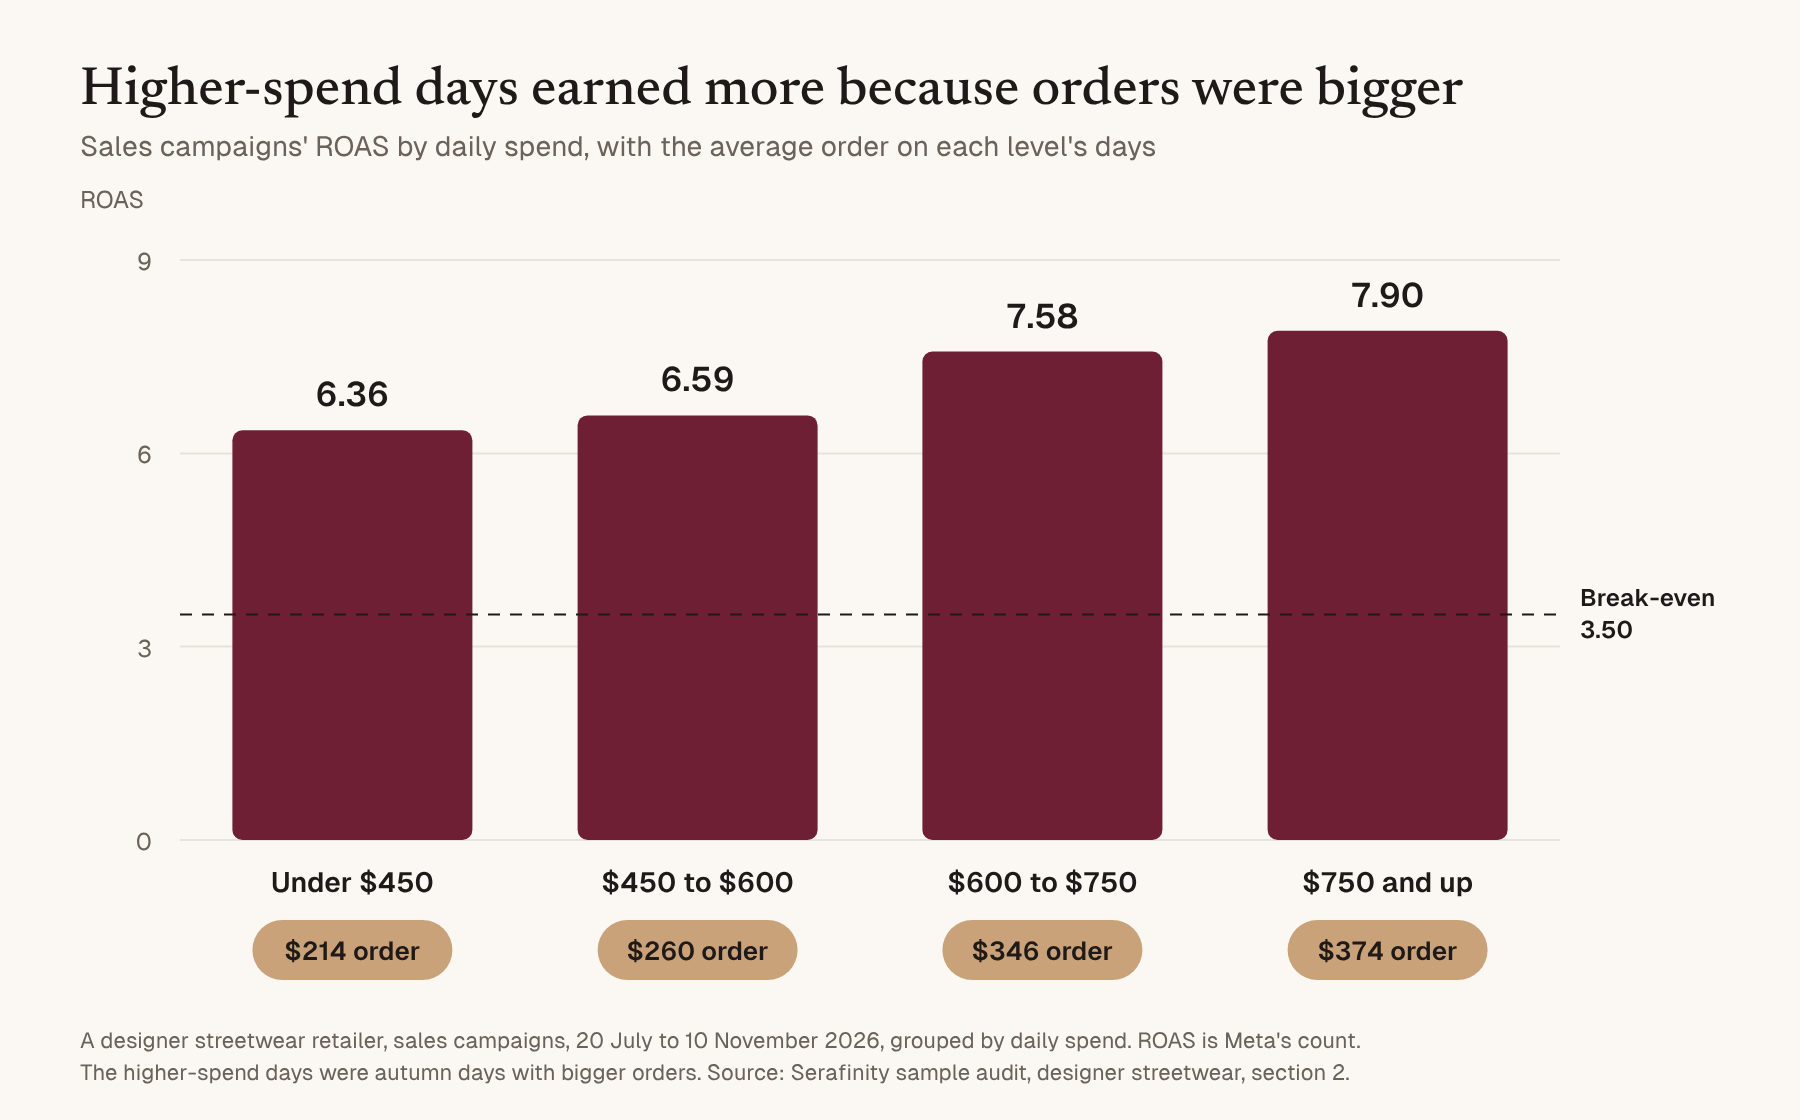
Often because of the season, not the budget. ROAS, the sales Meta credits to the ads for each dollar they cost, rose at every spend level in this store's sales campaigns since 20 July:
| Daily spend | Days | Spend a day | ROAS | Order value |
|---|---|---|---|---|
| Under $450 | 26 | $366 | 6.36 | $214 |
| $450 to $600 | 31 | $530 | 6.59 | $260 |
| $600 to $750 | 35 | $679 | 7.58 | $346 |
| $750 and up | 22 | $808 | 7.90 | $374 |
Read on its own, the table says spend more and earn more on every dollar. The last column says why it looks that way. The high-spend days were autumn days, when orders were bigger. The audit's verdict: "All of the rise in ROAS with spend came from order value, which is seasonal; at the same order value, higher-spend days earned less."
The rest of the funnel barely moved. Clicks cost more on the busier days, $0.21 at the lowest level and $0.27 at the highest, and Meta credited between 0.56% and 0.61% of link clicks with a purchase at every level. The extra money bought the same kind of buyer at a slightly higher price, in weeks when buyers spent more. In this account, orders grew through the autumn, so any budget raised in those weeks looked like it worked.
How do I know if the next dollar will pay?
Compare days within the same month, so the season is the same on both sides, and ask what the extra spend earned.
Across months, this store's sales seemed to grow faster than its spend. The audit's fitted curve gave an elasticity of 1.30, where 1 means sales rise in step with spend, so more budget looked like free growth. Within months, the same curve gave 0.86: sales rose more slowly than spend. That is the usual shape of a bigger budget, and it puts the next dollar at about 6.26, 1.8 times the store's break-even.
The audit is open about how firm that is. The within-month fit explains 12% of the variation within months, and the elasticity could sit anywhere from 0.42 to 1.31. So the next dollar earns 3.0 to 9.5, or 0.9 to 2.7 times break-even, and the low end loses money. It also describes only days the account has had, up to $977. The plan goes past that, which is why it climbs in steps instead of jumping.
A rougher version you can run on your own account:
- Export daily spend and purchase value for your sales campaigns for at least three months.
- Within each month, split the days into a lower-spend half and a higher-spend half.
- Divide the extra sales a day on the higher half by the extra spend a day. That is the ROAS on the extra spend.
- Compare it with your break-even, not with your average ROAS.
What break-even should I scale against?
Your own, built from every cost an order carries, not a calculator's. Break-even is the ROAS at which the ads exactly pay for themselves.
This store puts its break-even at 3.50: an average order of $287.35 leaves $82.10 to pay for the ad that won it. Product cost, card fees, packing and returns alone would have put break-even at 2.21. The store's figure carries $47.73 an order of costs that research can't see, such as staff or shipping the store pays. On the calculator's number, a ROAS of 3 would have looked profitable while it lost money on every extra order.
How much should I raise the budget each time?
About 20% at a time, held for at least a week. This is the audit's ladder for the store's sales campaigns:
| Step | Budget a day | Size | Earliest start | Extra sales a week below which the step loses money |
|---|---|---|---|---|
| Today | $700 | |||
| 1 | $850 | +21% | 16 November | $3,675 |
| 2 | $1,000 | +18% | 4 January | $3,675 |
| 3 | $1,200 | +20% | 11 January | $8,575 |
| 4 | $1,450 | +21% | 18 January | $14,700 |
| 5 | $1,750 | +21% | 25 January | $22,050 |
The last column is the spend added since the base, times 7 days, times the break-even of 3.50. Step 1 adds $150 a day, so it has to bring in at least $3,675 of extra sales a week, or it loses money on Meta's count.
Three rules keep each read clean:
- One step at a time, none skipped, each held for at least 7 days.
- Nothing else changes in the stepped campaigns during a step week. New ads go into a separate testing campaign at a fixed $100 a day, which is left out of every read.
- Each step is new ground once the budget passes $808 a day, the account's top spend level since July, so each one gets its own read.
Should I raise my budget every few days?
No, not if you want to know whether each raise paid. The usual advice online is to raise the budget 20% to 30% every 2 to 3 days. In this account, a single day's ROAS swings by about 44% around its average and a week's by about 32%, so a raise every few days leaves nothing you can read.
Size matters as well as speed. Meta lists a budget change among the edits that "may or may not be significant, depending on the magnitude of the change", and gives an example: "if you increase your budget from $100 to $101, that isn't likely to cause one or more ad sets to reenter the learning phase. However, if you change your budget from $100 to $1000, one or more ad sets may reenter the learning phase" (Meta, Significant edits and learning phase). The learning phase is the period when Meta's delivery is still working out whom to show the ads to, and results are less stable.
How do I judge a budget step?
Against break-even, over two weeks, and against a campaign you left alone.
The audit's read, every Monday:
- Take the stepped campaign's credited sales for the week.
- Take off its weekly average in the base weeks before the climb, raised or lowered by how much a campaign held flat has changed since then. Here the brand catalog campaign stays at $150 a day for exactly this job.
- Divide what is left by the extra spend Meta delivered above the base. That is the step's ROAS on the extra spend.
Then the rule. If a week reads below break-even, hold instead of climbing. If the next week reads below too, go back one step. A week that can't be read counts as below.
Two more numbers get checked each week. If the share of store orders Meta credits to the ads rises more than 10% over the base weeks, the climb may be buying credit for orders that would have come anyway. If order value falls more than 10% beyond the held-flat campaign's, the climb may be buying cheaper orders.
Can I trust Meta's numbers when I scale?
Partly. Meta credits this store's ads with at least 71% of its online orders, and its prospecting can reach past buyers, so some of what the extra dollar earns on Meta's count would have come anyway.
A lift test settles it by holding a random group back from the ads and comparing what both groups buy. Meta describes it as comparing "groups of people who did and did not have the opportunity to see your Meta advertising" (Meta, About lift and holdouts), and says single-cell results "should be interpreted as the floor of Meta performance" (Meta, Best practices to interpret conversion lift test results). The plan runs one from 21 December to 17 January with at least 10% held back. From the final read on 25 January, every weekly read is multiplied by the share of sales the ads add on their own.
What can scaling earn, and what can it lose?
Over 90 days, between $11,699 less and $71,609 more profit than carrying on, with $21,367 more as the central case. The ladder spends $102,800 on the sales campaigns, 1.63 times what carrying on at today's level would. On Meta's count and the store's break-even:
| The 90 days | Profit after ads | Against carrying on |
|---|---|---|
| Carry on at today's level | $67,383 | |
| Ladder, low end of the likely range | $55,684 | -$11,699 |
| Ladder, along the within-month curve | $88,750 | +$21,367 |
| Ladder, high end of the likely range | $138,992 | +$71,609 |
The audit says to plan cash on the low end. The weekly read exists to catch that case early: two weeks below break-even and the climb goes back a step.
Questions owners ask next
Should I scale during Black Friday?
Take one step before it, then hold. The plan raises the budget to $850 on 16 November, runs the four peak days at $1,000 and comes back to $850 on 1 December. In this account the peak made 3.1 times the ROAS of the three weeks before in 2024 and 1.9 times in 2025, on budgets of $203 and $279 a day, so four times the spend won't earn four times the sales.
Should I scale in a new campaign?
The plan raises the existing catalog campaign and keeps new ads in their own testing campaign, so a step's read isn't mixed up with new ads learning. Winners move into the main campaign only in weeks without a step.
My ROAS dropped after a step. Should I go back?
Not after one week. Hold the step. If its ROAS on the extra spend reads below break-even a second week, go back one step.
About this data
The figures come from a Serafinity sample audit of an online designer streetwear retailer, published with the client's permission and anonymised, with every account figure exactly as read on 11 November 2026. It covers $111,815 of spend from 11 May to 10 November 2026. Every figure in this post was checked against the page of the audit it comes from: the spend levels are in section 2, the credited share in section 7, the break-even in section 8, the plan and the ladder in sections 19 and 20, Black Friday in section 21 and the outcomes in section 23. ROAS here is Meta's, as Ads Manager reports it, and the store also sells in person, which Meta can't see.
Meta's guidance is quoted from its Business Help Centre, checked on 12 November 2026. You can read the full designer streetwear sample audit (PDF), or see what an audit of your own account costs. Serafinity audits accounts and does not run them, so nothing here is a pitch for management.
Sources
- Serafinity, Meta Advertising Audit and 90-Day Scale Plan, designer streetwear sample: section 2 (page 5), section 7 (page 10), section 8 (page 11), sections 19 and 20 (pages 22 to 24), section 21 (page 25) and section 23 (page 32). https://serafinity.com/sample-audit-designer-streetwear.pdf
- Meta, "Significant edits and learning phase," Meta Business Help Centre, checked 12 November 2026. https://www.facebook.com/business/help/316478108955072
- Meta, "About lift and holdouts in Facebook advertising tests," Meta Business Help Centre, checked 12 November 2026. https://www.facebook.com/business/help/552097218528551
- Meta, "Best practices to interpret conversion lift test results," Meta Business Help Centre, checked 12 November 2026. https://www.facebook.com/business/help/2943790779140325
More answers
Why did my ROAS drop when I increased my Meta ads budget?
In one audit, spend over $5,000 a day returned 1.26, then 1.02, against a 1.39 break-even. Why ROAS drops as you increase a Meta budget: diminishing returns.
Should I increase my Meta ads budget for Black Friday 2026?
In a real audit, Black Friday week to Cyber Monday made a ROAS of 12.27 on 28% more spend a day than the four weeks before. How to set your 2026 Meta budget.
Why did my best Meta ads suddenly stop working?
In one real store, all 8 long-running winners earned less per dollar later; the median lost 28%. How to tell a tired ad from a tired account.